- Make a double stem and leaf plot
using the two data sets given in Problem 4 on page 512.
Class 1 Class 2 1 2 2 5 9 4 6 0 4 4 4 5 5 6 6 7 8 0 0 2 2 3 3 4 4 5 5 6 6 8 8 3 3 4 4 6 6 6 7 7 0 3 3 4 4 5 6 7 8 3 4 6 6 6 5 4 - Make a single comparison histogram
using the two data sets given in Problem 4 on page 512.
Choose an appropriate bin length; justify the length you use.
A length of 10 would be reasonable, but there would be only five bins.
A length of 5 shows a bit more detail while still making it easy
to see clustering by grouping the data. The data for Class 1 is
shown with bars made of x's (it's hard to create graphical bars in html)
and the data for Class2 by y's.
                                             y
                                             y
                         x                   y
                         x       y           y   x
                         x     x y   x y   x y   x y
                         x     x y   x y   x y   x y   x
                   x     x     x y   x y   x y   x y   x
         y         x     x y   x y   x y   x y   x y   x y   x y
45-49 50-54 55-59 60-64 65-69 70-74 75-79 80-84 85-89 90-94 95-100
Answer: These categories overlap, as is made clear by the fact that the percentages add to well over 100%; someone might well have both a job and live off campus. Thus it makes no sense to use pie charts, since the data do not represent parts of a whole. Nor is there any trend; the data may give a profile of the students but it does not involve numbers changing over time, so line graphs are not called for. Histograms are for when you have a list of data values, and you want to show how often the values fall in various ranges. Since we do not just have a list of numbers, we would not use a histogram. Thus the bar chart is best, since it can show our data, while none of the other options is appropriate.
Answer:
- (a) The graph at first seems to show a rising management health care contribution. The graph also makes it hard to read what the actual percentages are, since the three dimensional effect used occludes the scale.
- (b) The actual contributions are about 48%, 46%, 45%, and 42% from 2000 to 2004. Thus the actual percentages are declining whereas the 3D line graph itself is shown with a rising line, which makes the graph misleading.
Answer: Randomly pick a starting entry in the table, say the entry in row 5 column 3. Then read down and pick the last two digits of each entry, skipping an entry if it gives a number already chosen. (If the two digits are 00 then that counts as 100.) Here is the simple random sample I get: 26, 6, 59, 32, 25, 10, 20.
Answer: Randomly pick a starting entry in the table, say the entry in row 2 column 4 (which is 64569). Then read down that column, counting from 1 to 10 as you go. Every time the last two digits of the entry gives a number between 1 and 40 inclusive, the number you counted is selected. The results are given in the following table, where the first column gives the count from 1 to 10, the second column gives the corresponding table entry, the third column gives its last two digits and the fourth column indicates whether we select the number in the first column or not:
 1     64569   69   do not select 1
 2     17707   07   do select 2
 3     60638   38   do select 3
 4     93608   08   do select 4
 5     78545   45   do not select 5
 6     39445   45   do not select 6
 7     50784   84   do not select 7
 8     33358   58   do not select 8
 9     36246   46   do not select 9
10     17068   68   do not select 10
Our 40% independent sample is thus {2, 3, 4}.
Answer: The book gives a solution on page 920.
- Find the mean of this data: (1+5+6+6+7+8+8+9+11+20)/10 = 8.1
- Find the median of this data: take the middle data value if there is one, else average the two middle values, which in this case are 7 and 8 so the median is (7+8)/2 = 7.5.
- Find the mode(s) of this data: 6 and 8, since they occur the most often.
- Is the data skewed left or right? It is skewed right since the mean is bigger than the median.
- Find the range of this data: 20-1=19
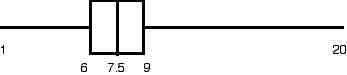
- Create and label a box and whisker plot of this data:
the five number summary is the minimum, 1, the first quartile, 6, the median, 7.5,
the third quartile, 9, and the maximum, 20.
- Find the sample standard deviation of this data: the variance is [(1-8.1)2+(5-8.1)2+(6-8.1)2+(6-8.1)2+(7-8.1)2+(8-8.1)2+(8-8.1)2+(9-8.1)2+(11-8.1)2+(20-8.1)2]/(10-1) = 24.544, so the sample standard deviation is the square root of this, or about 4.95.