Introduction
Cay tablets prove the Babylonians, more than 3000
years ago, knew how to estimate square roots. Evidence
suggests they used the following iterative method to estimate
N1/2.
- Pick any value x1 > 0
as a first estimate.
- To get a better second estimate x2, divide the average of
x12 and N by x1.
- To get an even better estimate x3, repeat the process
using x2 in place of x1.
- Likewise, get x4, x5 and so on.
Items To Do
- Pick your N: use N = 1.5XY where XY are the fourth and fifth
digits of your student ID (i.e., the numbers between the hyphens,
as in 123-XY-0012): N = 1.599 (say)
- Express x2 in terms of x1
(use correct mathematical notation):
x2= ((x12 + N)/2)/x1
- Likewise, express x3 in terms of x2
and then xn+1 in terms of xn:
- x3= ((x22 + N)/2)/x2
- xn+1= ((xn2 + N)/2)/xn
- Using N from above and 3 for your initial estimate
x1, indicate what you get for x2 through
x6 (if x6 is not very close to N1/2,
you've made a mistake somewhere):
- x2 = 1.76650000000
- x3 = 1.33583986697
- x4 = 1.26641981342
- x5 = 1.26451714901
- x6 = 1.26451571758 (note: N1/2 = 1.26451571757729)
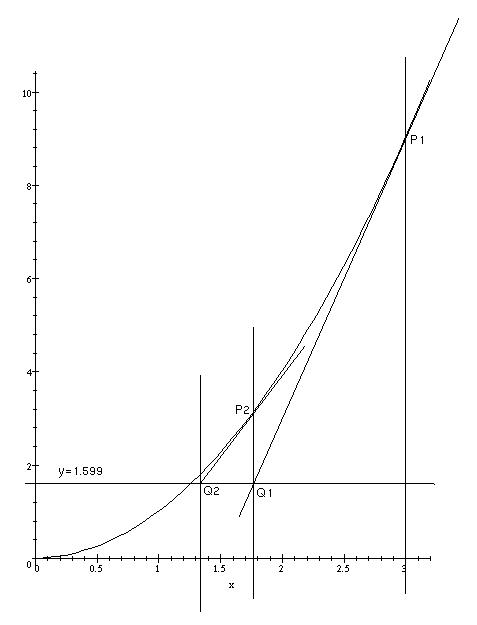
- On the accompanying graph (BELOW) of f(x) = x2,
very carefully and accurately draw in and label the line y = N.
What is the significance of the x-coordinate where
the graphs of y=f(x) and y=N intersect?
(Use a complete sentence in your answer.)
The x-coordinate of the point where the two
graphs intersect is N1/2.
- Again on the accompanying graph of f(x) = x2,
plot and label the points P1 = (x1, f(x1)) and
Q1 = (x2, N) and draw in the line through
these points P1 and Q1.
Do likewise for P2 = (x2, f(x2))
and Q2 = (x3, N).
(If your points and lines are not very
carefully placed, you will not see what you need to see.)
What is special about the line through P1
and Q1 among all lines through P1?
Is this special behavior true for the line through
P2 and Q2? (Use complete sentences in your answer.)
Both lines are tangent to the graph of f(x) = x2.
- Based on your answers above, describe a procedure
for how you could graph the points (x2, N), (x3, N),
(x4, N), and so on, just using a ruler
and your graphs of f(x) = x2 and y= N, without
ever resorting to a calculator to compute any values of xn.
Explain briefly, perhaps referencing your accompanying graph,
how your procedure shows that xn gets closer and closer to
N1/2 as n gets bigger and bigger.
(Use good English and complete sentences.)
To plot the point (x2, N), draw in the line tangent to
the graph of f(x) = x2 at the point P1. This
line crosses the line y = N at the point Q1 = (x2, N).
The point P2 is the point where the vertical line through
Q1 crosses the graph of f(x) = x2.
Now draw in the line tangent to
the graph of f(x) = x2 at the point P2. This
line crosses the line y = N at the point (x3, N). In general,
given the point Qn = (xn+1, N), Pn+1 is the point where the vertical line through
Qn crosses the graph of f(x) = x2, and
the line tangent to
the graph of f(x) = x2 at the point Pn+1
crosses the line y = N at the point Qn+1 = (xn+2, N).
By repeatedly drawing in these tangents, we can obtain the points
(x2, N), (x3, N),
(x4, N), and so on.
Note that the tangent line at Pn intersects the line
y = N to the left of Pn. Thus xn+1 is always smaller
than xn. But the tangent lines are always below
the graph of f(x), so the points Q1, Q2, etc.,
although proceeding to the left, are always to the right of
the point where y = f(x) and y = N intersect. I.e.,
the values x1, x2, etc., are decreasing
but are all bigger than N1/2. Thus the values
of xn are getting closer and closer to N1/2.